AWS CloudWatch provides an monitoring service for AWS cloud resources and applications that run in AWS. It’s important to be able to monitor processors, logs, and metrics when it comes to AWS CloudWatch. By reading this article, you can get the answer to some of the most common AWS CloudWatch Interview Questions.It’s a detailed blog-post which help you in passing an AWS job interview.
AWS CloudWatch Interview Questions
The article will cover all the topics you will likely be asked about in an AWS interview, including processors, logs, and metrics. AWS CloudWatch Interview Questions will help you stand out from the crowd and ace your AWS interview.
We’ve listed a few of the most frequently asked questions concerning AWS Cloud-Watch.
1: What is AWS CloudWatch?
AWS CloudWatch provides a monitoring service that monitors AWS Applications and Resources. It offers insight to the efficiency of AWS resources, including instances like EC2, RDS-DB instances, as well as DynamoDB-tables. CloudWatch also monitors AWS Lambda functions and Amazon API Gateway APIs. You can utilize CloudWatch to create alarms that will automatically respond to changes to Your AWS resource.
2: What types of AWS resources can I monitor with CloudWatch?
CloudWatch can be used AWS CloudWatch to keep track of AWS resources, such EC2, RDS-DB instances, dynamoDB-tables, AWS Lambda functions, and Amazon API Gateway APIs.
3: How Amazon CloudWatch works?
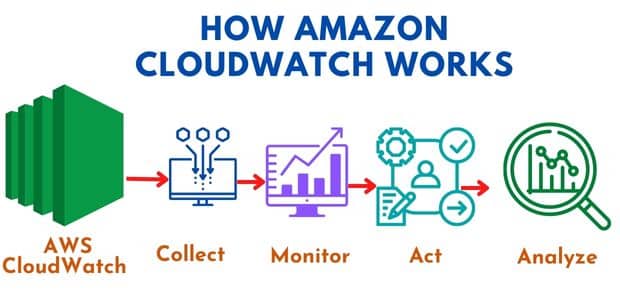
Amazon CloudWatch provides a unified service to monitor and manage your applications and infrastructure resources. It is a web service that you can use to collect and track metrics, gain insight into your application and its underlying infrastructure, and react to changes with automation.Utilizing Amazon CloudWatch it is possible to keep track of AWS resources and tailor the monitoring to meet the needs of your business.
For example, you can monitor the number of visits to your web application, the latency of requests to your application, and the status of your Amazon EC2 instances. You can also utilize Amazon CloudWatch to build custom metrics, set alarms and react automatically to any changes that occur in your system using AWS Lambda.
4: What metrics can I collect with CloudWatch?
CloudWatch metric data is stored as time-series data points. A time-series data point has a timestamp and a unit of measurement. AWS CloudWatch metric data is collected for a period that you specify, called the AWS CloudWatch metric data retention period.
5: How can I monitor my AWS resources in near real-time?
You can use AWS CloudWatch to collect and track metrics in near real-time. Its metric data is stored as time-series data points. And a time-series data point has a timestamp and a unit of measurement. AWS CloudWatch metric data is collected for a period you specify, called the AWS CloudWatch metric data retention period.
6: What to configure AWS CloudWatch alarm?
A AWS CloudWatch alarm watches a single metric for a time that you define and takes an action or two depending on the metric’s value in relation to a threshold that you have set. The metric can be from any AWS service in any region, and you can select the alarm to watch multiple AWS services in multiple regions.
7: How AWS CloudWatch alarm is different from AWS CloudTrail?
AWS CloudTrail can be described as a web-based service that records AWS API calls to AWS resources within the account of your AWS accounts. Whereas AWS CloudWatch is an AWS monitoring-service that monitors AWS resources and applications that run within AWS. It is possible to use AWS CloudWatch to set up alarms which automatically react to changes to your AWS resources.
8: What are some of the benefits of using AWS CloudWatch?
AWS CloudWatch gives you insight on the overall performance and efficiency of AWS resources, including Amazon EC2 instances, Amazon DynamoDB tables, as well as Amazon RDS DB instances. CloudWatch also monitors AWS Lambda functions and Amazon API Gateway APIs. You can use CloudWatch to set alarms that automatically react to changes in your AWS resources.
9: What is Amazon CloudWatch Synthetics?
AWS CloudWatch Synthetics is a monitoring service that allows you to create synthetic canaries. A canary is a script that runs periodically to check the availability and performance of your web applications and APIs. Amazon CloudWatch Synthetics can monitor your endpoints for changes, failures, or degraded performance. AWS CloudWatch Synthetics can also help you troubleshoot production issues.
10: What is AWS X-Ray?
AWS The X-Ray service is an monitoring service that monitors AWS services and resources. You can use AWS X-Ray to trace the requests and responses between services in your application. AWS X-Ray also provides integration with Amazon CloudWatch so that you can view your X-Ray data in CloudWatch dashboards. AWS X-Ray is available in all AWS regions.
11: What is an AWS CloudWatch dashboard?
An AWS CloudWatch dashboard is a graphical display of metrics and alarms that you can use to monitor your AWS resources and applications. You can create dashboards to display data from AWS CloudWatch, Amazon EC2, Amazon DynamoDB, Amazon RDS, and other AWS services.
12: How do you create a dashboard in CloudWatch?
CloudWatch allows you to create a dashboard by clicking the “Dashboards” link in the left-hand sidebar and clicking “Create Dashboard”. You’ll then be asked to provide your dashboard’s name and description. You can then begin adding widgets.
13: What is a CloudWatch metric?
A CloudWatch metric is a time-series data point representing the value of an AWS resource or application at a specific time. AWS CloudWatch metric data is collected for a period that you specify, called the AWS CloudWatch metric data retention period.
14: What is CloudWatch logs?
CloudWatch Logs are an AWS service that you could make use of to keep track of your logs, access, and store your log files via Amazon EC2 instances, AWS CloudTrail and other sources. CloudWatch Logs uses an agent to collect log data from your AWS resources and store it in a log group. You can then view and search the log data in the AWS CloudWatch console.
15: What is AWS CloudTrail, and how is it different from cloudwatch?
AWS CloudTrail is a web service that records AWS API calls for AWS resources or logs in to your AWS account. AWS AWS CloudWatch can be described as an monitoring service for AWS resources as well as applications that are running within AWS. You can utilize AWS CloudWatch to set up alarms that will automatically respond to changes to the state of your AWS resource.
16: Where are AWS CloudWatch logs stored?
AWS CloudWatch Logs is an AWS service you can make use of to monitor, save and retrieve the log files you have stored from Amazon EC2 instances, AWS CloudTrail and different sources. CloudWatch Logs uses an agent to collect log data from your AWS resources and store it in a log group. You can then view and search the log data in the AWS CloudWatch console.
17: How do you delete a dashboard in AWS CloudWatch?
You can delete an AWS CloudWatch dashboard by clicking the “Dashboards” link in the left-hand sidebar and selecting the dashboard you want to delete. Then it will confirm from you for the deletion. The AWS CloudWatch dashboards are stored in an Amazon S3 bucket, so you will need to delete the dashboard from Amazon S3 as well.
18: How do you create an alarm in AWS CloudWatch?
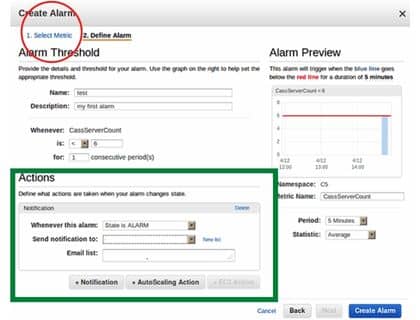
You can create an alarm in AWS CloudWatch by clicking the “Alarms” link in the left-hand sidebar and clicking “Create Alarm”. Then, you will be asked to choose which AWS resource you would like to track, the metric you’d like to monitor and the threshold to trigger the alarm, as well as the actions you would like AWS CloudWatch to take when the alarm goes off.
19: What is an AWS CloudWatch metric?
An AWS CloudWatch metric is a time-series data point representing the value of an AWS resource or application at a specific time. AWS CloudWatch metric data is collected for a period that you specify, called the AWS CloudWatch metric data retention period.
20: What types of monitoring can Amazon CloudWatch be used for?
The Amazon CloudWatch can be used for a variety of AWS resources, such as DynamoDB tables and instances of EC2 as well as Amazon RDS DB instances. CloudWatch can be used to also monitor AWS applications, such as Apache Tomcat, Skype for Business as well as Exchange Server.
21: What is an AWS CloudWatch Log Group?
An AWS CloudWatch Log Group is a collection of AWS resources and applications that generate log data. You can use CloudWatch Logs to keep track of, store and access your logs through Amazon EC2 instances, AWS CloudTrail and other sources.
22: What are three things you can do in CloudWatch?
- You can monitor AWS applications and resources in real-time.
- Set alarms to automatically react to changes to your AWS resources
- View and search log data in AWS CloudWatch Logs
23: What is the AWS CloudWatch Agent?
The AWS CloudWatch Agent is a software program installed on your Amazon EC2 instances, Amazon ECS containers, or on-premises servers. The AWS CloudWatch Agent enables you to collect system-level performance metrics from these AWS resources and send them to AWS CloudWatch.
24: What is CloudWatch rule?
An AWS CloudWatch rule is a statement that defines when and how AWS CloudWatch Events should respond to an event. Simple rules can be easily established to identify events, and then connect the events to the streams or functions you want to target.
When creating a rule, you specify the events you want AWS CloudWatch Events to watch for. You also identify the actions you want AWS CloudWatch Events to take when detecting those events.
25: What AWS services can CloudWatch Events be integrated with?
The CloudWatch events can be integrated with many AWS services, including AWS CloudTrail, or other sources. CloudWatch Logs uses an agent to collect log data from your AWS resources and then store the log data.
26: What are states of the Cloud-Watch metric alarm?
An AWS alram has thress states that is OK state, Alarm state and INSUFFICIENT_DATA.
27: What is period in CloudWatch?
An “period” is the duration of time connected with a specific Amazon CloudWatch statistic. Each statistic is an amalgamation of the metrics data that was collected over a specific duration of time. The term “period” is defined in terms of seconds. You can use values 1 10 5 30, or any other multiple of 60 for a period.
Conculsion
AWS Cloud-Watch is a monitoring utility that provides logs, metrics and insights into the state of your AWS cloud applications. CloudWatch allows you to gather and report metrics about different types of resources within your AWS account. You can use these data to determine how your applications use resources.
This blog post lists common AWS CloudWatch interview questions, based on the real-life experience of the AWS customer support team.


